I’m Speaking at SQL Saturday #522 Jacksonville

I will be speaking at SQL Saturday Jacksonville on May 7th 2016. I will be doing an introductory session on SSAS multi-dimensional. So come on out and enjoy this free event. There are dozens of different speakers covering a wide variety of topics. Click on the link below to see the full schedule and register.
Here’s a link to the event along with further information. http://www.sqlsaturday.com/522/EventHome.aspx
Here’s a link to the registration, go sign up today.
https://www.sqlsaturday.com/522/registernow.aspx
Recursive Reporting with SSRS
In this blog I will walk you through an example of how to use SSRS to report on recursive data. If you have a self referencing table or even a Parent-Child hierarchy setup in an SSAS multidimensional cube you could find these techniques useful. In our example below we want to display the data within a multi-level hierarchy. We will be working with HR data and we want to see the CEO at the top of hierarchy and then see who reports to who after that.
In this example I will be using the Adventure Works sample data warehouse (AWDW) so that you can follow along step by step. Let’s assume that we already have a blank report created and that we also have a shared data source that’s connected back to the AWDW.
We will be working with the data from the DimEmployee table. You can use the following query to return the columns that we need.
Select
[EmployeeKey]
,[ParentEmployeeKey]
,[FirstName] + ‘ ‘ + [LastName] AS FullName
,[Title]
From [dbo].[DimEmployee]
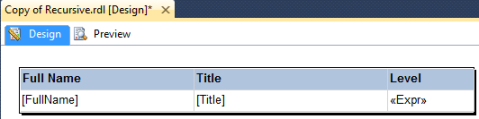
Now let’s get to the fun stuff. The first thing that we need to do is to build out a table. Insert a table into the design tab and then drag over the FullName and Title fields into the table/report.
To further show you what’s happening here we will use an SSRS expression for a third column. I labeled this new column as Level. The label of this new column probably gave it away but we will be using the Level function within the SSRS expression. The Level function will return a zero-based integer representing the current depth level of a recursive hierarchy.
Here’s the expression, =Level()
What your report should look like up to this point
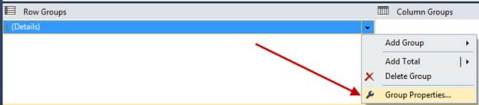
Next we then need to navigate to the to the group properties of our Detail Group.
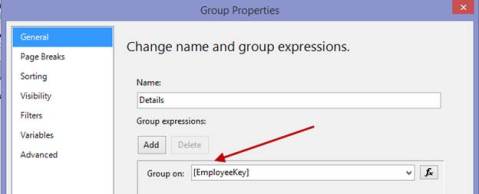
On the general tab of the group properties we need to add a grouping on EmployeeKey as shown below.
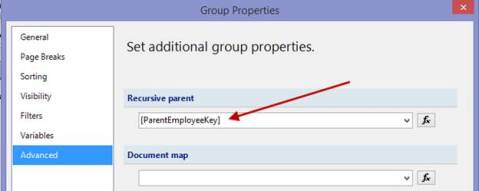
Pretty easy but we’re not done yet. On the Advanced tab of the group properties you will notice a section labeled as Recursive Parent. In this section we need to select the ParentEmployeeKey as shown below.
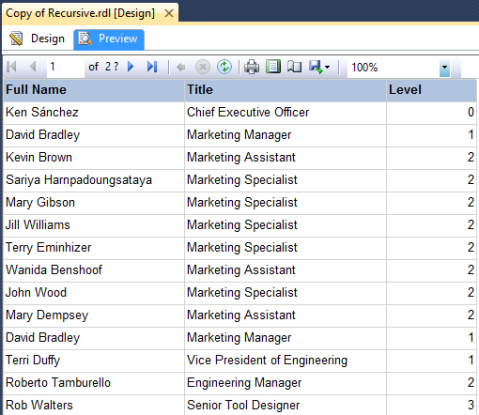
Go ahead and preview the report and you will notice that the report will work. However, if you look closer it’s still less than desirable to look at because it’s still somewhat challenging to see the parent child relationship. Notice the third column we created earlier with the Level function.
Let’s clean it up a bit by using some additional SSRS expressions.
The first one will add some additional padding so that it looks more like a natural hierarchy. Right click on the FullName column in the detail row group and go to Text Box properties -> Alignment. Locate the Left Padding property and use the following expression. As you can see this expression is using the same Level function like we did earlier to dynamically set the padding based on what level in the hierarchy it lands.
=CStr(2 + (Level()*20)) + “pt”
Next we will set the font style of the parent values in the hierarchy using the following SSRS expression. This expression will count the number of rows returned for each group, if it’s greater than 1 it will have bold font.
=IIF(Count(Fields!FullName.Value, “Details”, Recursive) > 1, “Bold”, “Normal”)
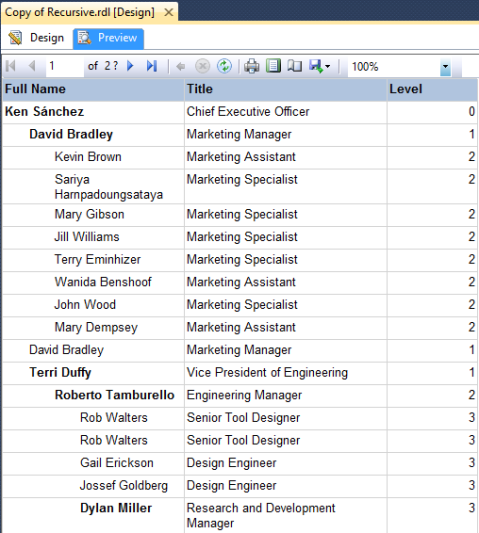
Now preview the report again and you will notice the additional formatting we just applied. With this new formatting applied we can quickly and easily see how the data and the different levels are related to each other.
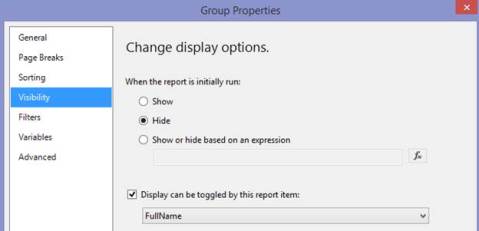
Do you need to add drilldown functionality for each level of the hierarchy? If so navigate back into the Details row group properties. On the visibility tab set the group to be hidden and toggle this based on the FullName field within the group.
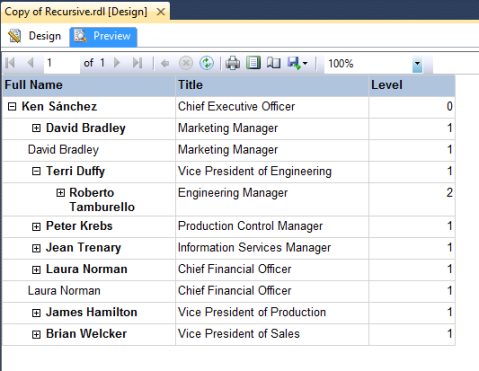
Preview the report now and you can see the drilldown that we just implemented.
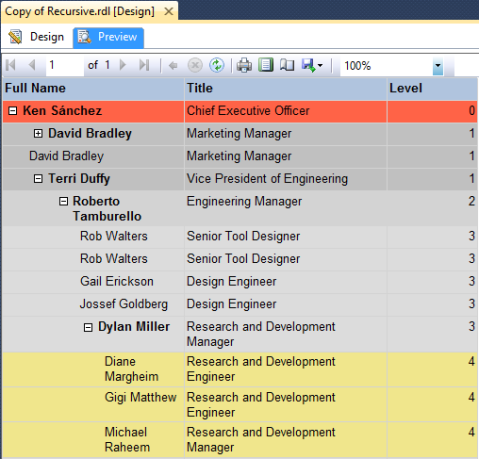
We can even adjust the row background color based on the Level as well.
Use an expression like this and pick the colors of your choice. The row property that needs to be set is BackgroundColor.
=SWITCH(Level()=0, “Tomato”,Level()=1, “Silver”,Level()=2, “LightGrey” ,Level()=3, “Gainsboro”,Level()=4, “Khaki”)
I hope you enjoyed this post, thanks.
