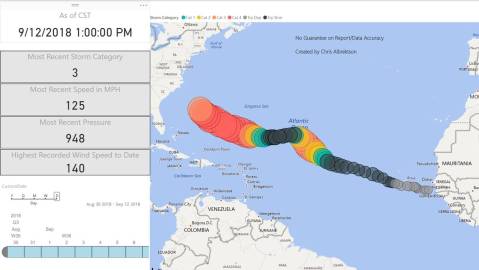
Tracking Hurricane Florence with Power BI
Here’s another version of my Power BI hurricane tracker that’s been updated for Hurricane Florence.
Click HERE for the updated and interactive report.
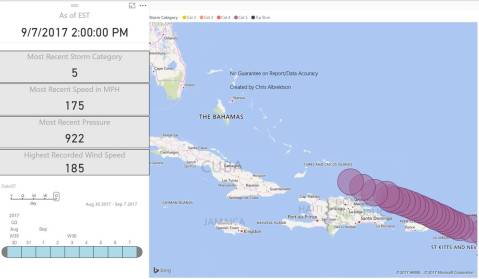
Tracking Hurricane Irma with Power BI
Here’s a (SQL) to the Power BI Hurricane tracker that I did last year for Hurricane Matthew. It’s not 100% perfect but it gets the job done. It should update every couple of hours, enjoy. Stay safe my fellow Floridians.
Click here to see the live report
SQL Saturday 649 Session Recap

We had a great session today on SSRS 2016 and all of its new features. As I mentioned this morning you can download and experiment with these tools without having to install SQL2016. Here are a couple links for the downloads that I would like to share with you.
SSRS 2016 Report Builder Download
SSRS Mobile Report Publisher Download
Here’s the download for the slide deck. Whats new in SSRS 2016
Here’s a link to a Microsoft site with an overview of what was covered today. https://msdn.microsoft.com/en-us/library/ms170438.aspx
It’s almost that simple: Changing Azure SQL DW Service Objective (DWU Level) during ETL

Great blog from Bob Rubocki on how to scale up and down your SQL DW using TSQL and SSIS.
A feature of Azure SQL Data Warehouse is the ability to scale (and pay for) compute resources as needed. This is particularly useful when loading data to a data warehouse. ETL operations typically put heavy load on the data warehouse, and could benefit from increased computing power. When the load process completes, however, that extra power may no longer be necessary.
The simplest way to adjust the compute power setting (known as the Service Objective or DWU level) is using the slider in the Azure Portal, shown below. Sliding up increases compute power, sliding down decreases compute power.
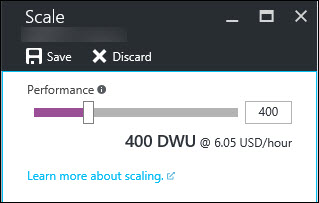 Scale Azure SQL DW Compute with Slider
You could use the slider GUI to manually increase the compute power prior to running the ETL, and decrease the power after the ETL finishes.
Compute power can also be changed with a PowerShell command, REST API call, or SQL command. Following is a sample of the…
View original post 767 more words
Tracking Hurricane Matthew with PowerBi
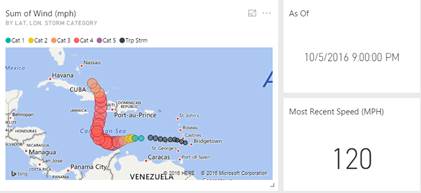
We’ve got company and it’s not the type of company that you want! As most Floridians are preparing for Hurricane Matthew I thought it might be neat to track the storm using PowerBi. So I went out and found some public data online and brought that into PowerBi, created a couple calculations and some visualizations.
My goal for this was to create a report where I could track the storm no matter where I was. I also needed the ability to see the latest data without any manual intervention. PowerBi can handle all of this for me utilizing the PowerBi Mobile app and a few other cool features.
So without further ado here’s the final result. Here’s a link to the report if you want to try it and see some other visuals.
*** Use at your own risk. I take no responsibility for the accurateness of this. Don’t use this as your only source of information on this storm. ***
Click to open the PowerBi reports for Hurricane Matthew
Here’s an image from the PowerBi app so I can track it on the go.
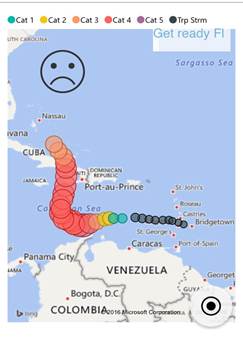
Here’s a new cool preview feature called ArcGis map. This will be cool once the storm get closer and I can add more layers. For more info on this check out the September 2016 updates for PowerBi. https://powerbi.microsoft.com/en-us/blog/power-bi-desktop-september-feature-summary/

Here’s an image from my dashboard I created on the PowerBi site.
SQL Saturday 531 Session Recap

We had a great session today on SSRS 2016 and all of its new features. As I mentioned this morning you can download and experiment with these tools without having to install SQL2016. Here are a couple links for the downloads that I would like to share with you.
SSRS 2016 Report Builder Download
SSRS Mobile Report Publisher Download
Here’s the download for the slide deck. Whats new in SSRS 2016
Here’s a link to a Microsoft site with an overview of what was covered today. https://msdn.microsoft.com/en-us/library/ms170438.aspx
I’m Speaking at SQL Saturday #531 Louisville
I will be speaking at SQL Saturday Louisville on August 6th 2016. I will be doing a session on what’s new in SSRS 2016. So come on out and enjoy this free event. There are dozens of different speakers covering a wide variety of topics. Click on the link below to see the full schedule and register.
Here’s a link to the event along with further information.
http://www.sqlsaturday.com/531/EventHome.aspx
Here’s a link to the registration, go sign up today.
SSRS 2016 Report Builder RC3
Want to experiment with some of the new 2016 SSRS features without having to install another instance? Well you’re in luck. Try downloading the new report builder RC3 which is now available.
https://www.microsoft.com/en-us/download/details.aspx?id=51935
Here are a few of the new enhancements that you can see in the new report builder.
- It has a new interface, if you have used it before you have nothing to worry about. It’s mainly cosmetic changes.
- It now has a custom parameters pane where to can move the parameters locations to some extent.
- Power Point Export
- New visualization’s and a few others.
Just keep in mind that most of the new fancy dash boarding, KPI and mobile dashboards features will still require you to install SSRS 2016 and setup the web portal.
The link below will also go over some other install options as well.
https://msdn.microsoft.com/en-us/library/ff519551.aspx
Also here’s a good link covering most if not all of the new SSRS 2016 features.
https://msdn.microsoft.com/en-us/library/ms170438.aspx
I’m Speaking at SQL Saturday #522 Jacksonville

I will be speaking at SQL Saturday Jacksonville on May 7th 2016. I will be doing an introductory session on SSAS multi-dimensional. So come on out and enjoy this free event. There are dozens of different speakers covering a wide variety of topics. Click on the link below to see the full schedule and register.
Here’s a link to the event along with further information. http://www.sqlsaturday.com/522/EventHome.aspx
Here’s a link to the registration, go sign up today.
https://www.sqlsaturday.com/522/registernow.aspx
Recursive Reporting with SSRS
In this blog I will walk you through an example of how to use SSRS to report on recursive data. If you have a self referencing table or even a Parent-Child hierarchy setup in an SSAS multidimensional cube you could find these techniques useful. In our example below we want to display the data within a multi-level hierarchy. We will be working with HR data and we want to see the CEO at the top of hierarchy and then see who reports to who after that.
In this example I will be using the Adventure Works sample data warehouse (AWDW) so that you can follow along step by step. Let’s assume that we already have a blank report created and that we also have a shared data source that’s connected back to the AWDW.
We will be working with the data from the DimEmployee table. You can use the following query to return the columns that we need.
Select
[EmployeeKey]
,[ParentEmployeeKey]
,[FirstName] + ‘ ‘ + [LastName] AS FullName
,[Title]
From [dbo].[DimEmployee]
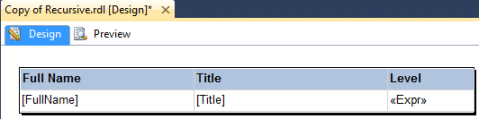
Now let’s get to the fun stuff. The first thing that we need to do is to build out a table. Insert a table into the design tab and then drag over the FullName and Title fields into the table/report.
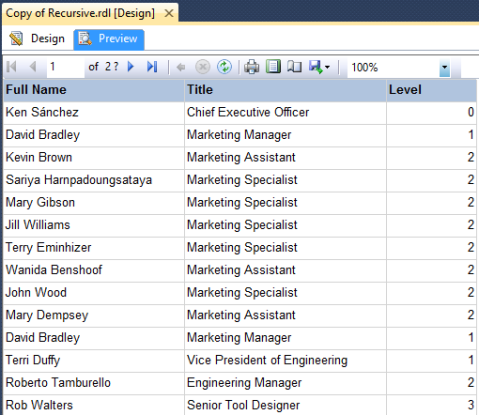
To further show you what’s happening here we will use an SSRS expression for a third column. I labeled this new column as Level. The label of this new column probably gave it away but we will be using the Level function within the SSRS expression. The Level function will return a zero-based integer representing the current depth level of a recursive hierarchy.
Here’s the expression, =Level()
What your report should look like up to this point
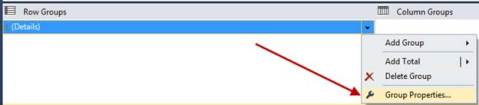
Next we then need to navigate to the to the group properties of our Detail Group.
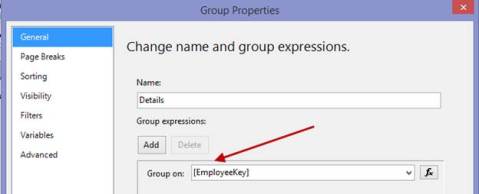
On the general tab of the group properties we need to add a grouping on EmployeeKey as shown below.
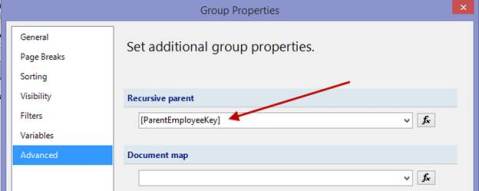
Pretty easy but we’re not done yet. On the Advanced tab of the group properties you will notice a section labeled as Recursive Parent. In this section we need to select the ParentEmployeeKey as shown below.
Go ahead and preview the report and you will notice that the report will work. However, if you look closer it’s still less than desirable to look at because it’s still somewhat challenging to see the parent child relationship. Notice the third column we created earlier with the Level function.
Let’s clean it up a bit by using some additional SSRS expressions.
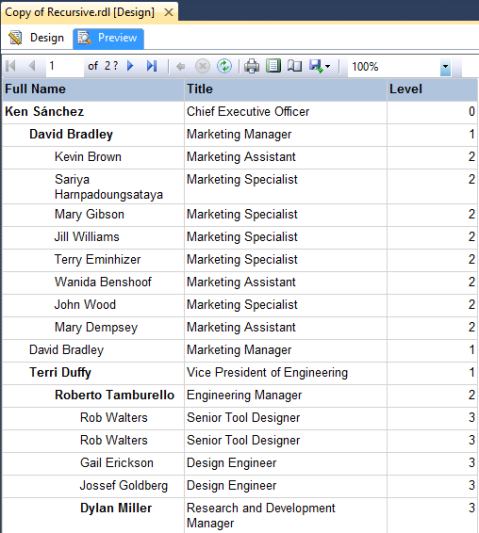
The first one will add some additional padding so that it looks more like a natural hierarchy. Right click on the FullName column in the detail row group and go to Text Box properties -> Alignment. Locate the Left Padding property and use the following expression. As you can see this expression is using the same Level function like we did earlier to dynamically set the padding based on what level in the hierarchy it lands.
=CStr(2 + (Level()*20)) + “pt”
Next we will set the font style of the parent values in the hierarchy using the following SSRS expression. This expression will count the number of rows returned for each group, if it’s greater than 1 it will have bold font.
=IIF(Count(Fields!FullName.Value, “Details”, Recursive) > 1, “Bold”, “Normal”)
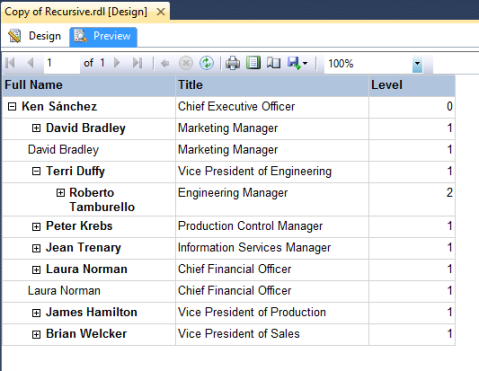
Now preview the report again and you will notice the additional formatting we just applied. With this new formatting applied we can quickly and easily see how the data and the different levels are related to each other.
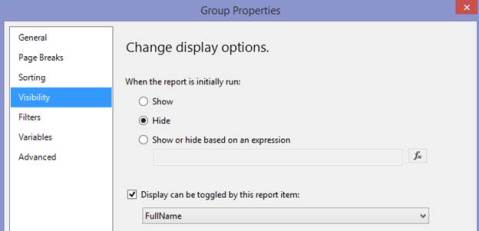
Do you need to add drilldown functionality for each level of the hierarchy? If so navigate back into the Details row group properties. On the visibility tab set the group to be hidden and toggle this based on the FullName field within the group.
Preview the report now and you can see the drilldown that we just implemented.
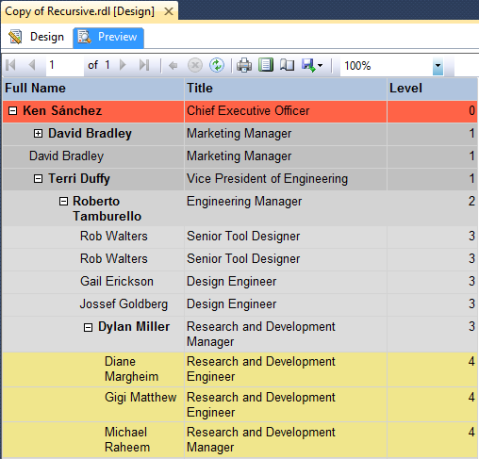
We can even adjust the row background color based on the Level as well.
Use an expression like this and pick the colors of your choice. The row property that needs to be set is BackgroundColor.
=SWITCH(Level()=0, “Tomato”,Level()=1, “Silver”,Level()=2, “LightGrey” ,Level()=3, “Gainsboro”,Level()=4, “Khaki”)
I hope you enjoyed this post, thanks.
