Testing SSRS Email Subscriptions with smtp4dev
If you ever need to test your SSRS email subscriptions without sending the emails in a development environment you might want to try out this free mock smtp server. You can find this on Microsoft’s CodePlex site which is a free open source project hosting site. On this site you can find a useful project called smtp4dev.
You can use this free tool for more than just SSRS email subscriptions but below I will show you how to set it up to get it working for SSRS. Again, you probably only want to do this is a development or local SSRS environment.
The first step is to download the smtp4dev project from CodePlex and go through the installation steps.
After that you will need to configure SSRS to use this tool. To do that you will need to open the Reporting Services Configuration Manager on the development\local SSRS instance. On the Email settings page type in localhost for the SMTP Server

After that go through the process of setting up an SSRS Email subscription. You can either wait for the subscription to run or you can start the SQL agent job associated with it.
When the subscription completes and smtp4dev has been started you should see the email delivered like shown below.

Once it has been delivered you can select the email from the window and select view. It will show you the contents of the email along with the report attachment and a link to the report itself.

And that’s it. I hope after reading this blog you can see how useful this can be during your SSRS development but also other software applications as well.
SSRS Object Visibility
From within the native mode installation of reporting services you have a couple additional features that you will not find in a SharePoint installation of SSRS. One of those features is the ability to hide objects from users from within the tile view. Please keep in mind this isn’t intended for security and if you have a smart enough user they can still find and use/consume these hidden reports. This feature is designed to help declutter your reporting environment.
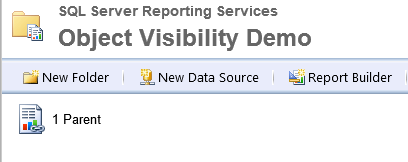
As you can see below I have a parent report that has a drill through action that passes some parameter values into the child report.

In the child report it has a parameter that’s hidden so that users can only consume this report if they navigate to it from the parent report via the report action/drill through. So currently the user can see and click on the child report but because the parameter is hidden they receive the following message.

So I would like to hide this child report from them so it’s more direct in which report they should use. So if I go into the report properties you will see a check box for an option to hide in tile view. Make this selection and select apply. When you go back into the folder this child report will be hidden.

Here’s the new view only showing the parent report.
However, the users will still be able to find this report and so can you. On the far right of the screen select the option to open the report manager in the details view.

From this detail view you can now see all of the objects including the hidden ones. So again this isn’t intended for security because of this. If you look closely you will notice that the child reports icon is slightly greyed out.

If you need to display this report again in the tile view you call follow these steps in the reverse order.
SSRS Linked Report

From within the native mode installation of reporting services you have a couple additional features that you will not find in a SharePoint installation of SSRS. One of those features is the ability to create a linked report. You can think of a linked report as a program shortcut that you can use to open a file or an application.
Essentially a linked report has the same layout as the original report that it was created from. However, you can adjust all of the report properties and settings like you would any other report without effecting the original report. Some of these could be subscriptions, security, location, parameters and more.
The two things that you can’t change are the data source and the report definition itself. This mean that you can’t open the linked report inside of report builder to make any changes to the report.
Linked reports are usually used for having different versions of the same report. For example, let’s say you have a report called ‘Sales by Region’ that will display sales information by region on a map. This report also has a parameter so that users can filter the region down to a particular area of the country. The default parameter is set to all. So if you wanted a variety of the same report each with its own default parameter value you could use this linked report functionality.
Below I will walk you through the process of creating a linked report.
First of all you need a report to work with inside of the report manager. So locate a report and click on the drop down arrow to see the list of options for a particular report and select the option to Create Linked Report as shown below.

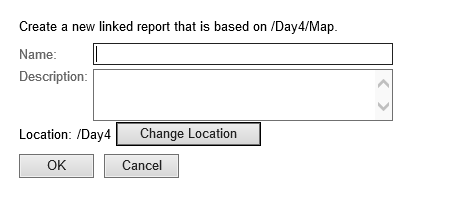
On the next menu give this new linked report a name and description. If you need to have the report moved into another location/folder you can do that as well.
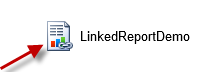
After that you should see the new linked report in the folder location you used above. Please take note that the icons are a little different for the linked reports.
In order to determine what report the linked report was created from you will need to open the properties of the linked report.

Below are some other useful Microsoft links on this subject as well.
http://msdn.microsoft.com/en-us/library/ms155998.aspx
http://technet.microsoft.com/en-us/library/ms156327(v=sql.90).aspx
MDX Formatter
Have you ever tried to export some MDX from SSRS, Excel or some other tool into SSMS to better try to read the code? Well if you have, you will know that it doesn’t format the MDX for you and places everything into a single row. This is very frustrating for developers because you have to spend the extra time formatting it.
However, if you do some google searching you can find some very useful tools that will do the formatting for you to make it easier to read without having to put the extra time and effort into it.
Here’s one that I use personally but others exist out there as well. I also like this one because it will also format DAX.
SSAS Sever Properties Error in SSMS
A couple of weeks ago I had my PC reimaged and upgraded some hardware at the same time. After, I was able to install SQL Server and everything seemed to be working correctly. Until I got the following error message.
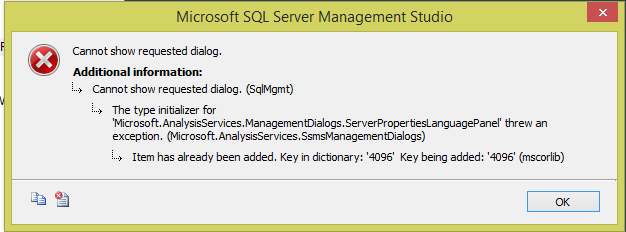
I received this error when I would try to go to the server properties of my SSAS instance. It turns out the problem was that I had received an older version of SQL 2012 which I probably should have checked for from the beginning and I was running windows 8.1. So the fix for me was that I needed to upgrade to the latest version of SQL 2012 SP2.
You could also try making the changes to the Msmdsrv.ini file as described in the following link. http://support.microsoft.com/kb/2889492/en-us
Also, this website is useful for list containing the different builds. http://sqlserverbuilds.blogspot.com/
Need Help Capturing MDX Queries? There’s an App for that.
Occasionally you might to capture the MDX query that’s being used for an excel pivot table. You might need this for performance tuning or maybe even just another option for learning MDX or how the MDX is being created behind the scenes in excel.
Now you have multiple options here. You could use the built in SQL Profiler tool to do this but you will need the appropriate permissions to use it. It can also be challenging just finding the query in the trace. Luckily for us we have third party options, either free or not. The one I’m going to be using here is the OLAP Pivot Table Extensions that can be found on CodePlex for free. Now the excel add-in can do more than just capture the MDX query but in this blog we will focus just on capturing the MDX that’s used for the pivot table.
Here’s a link where you can go download it along with other instructions on how to use some of its other features. http://olappivottableextend.codeplex.com/
Once you have the above add-in installed, go open an existing pivot table or create a new one. Now right click somewhere in the pivot table and select OLAP Pivot Table Extensions. It should be the very last option in the window.

Once you have selected this the OLAP Pivot Table Extensions Add-in will open. You will see several tabs but if you click on the MDX tab it will display the MDX query that’s used to return the results of the pivot table.

I hope you found this useful and informative.
December 2014 Speaking Engagements

This month I will be teaching two virtual training sessions. One will be focused on SSAS Masters content and the other will be focused on SSRS Masters content.
Check back for future post about upcoming dates for 2015.
The virtual session can be attended from anywhere in the world. I have had people from Asia, Africa, and Europe attend this class virtually without any issues. The training is 4 days long (half days only) and will be on 12/08/2014 – 12/11/2014 from 2-5 EST for the SSAS Masters class. The SSRS Masters class will be on 12/15/2014 – 12/18/2014 from 9-12 EST. The great thing about this class is that you have access to the recordings for up to 30 days after the class for reference.
For more details or to register for the SSAS Master class please go to the link below.
For more details or to register for the SSRS Master class please go to the link below.
Check back for future post about upcoming dates for 2015.
