SSRS: Adding a Bing Map Layer
With the release of the SSRS 2008 R2 reporting developers now have a new tool that they can use when creating reports. The new tool I am talking about is the new map wizard. With this you can easily show totals by state to track whatever information your company is trying to track. When using the wizard there’re a few options that you can use when setting up the visual appeal of the report. By default you can use one of three options.
- USA by State
- USA by State Exploded
- USA by State Inset
By using one of those options you will get a map that will look like the example below.
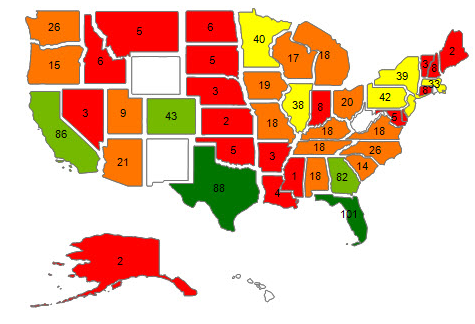
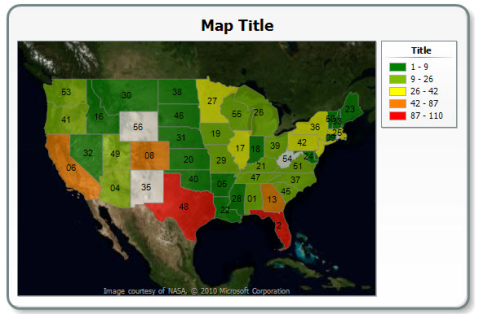
In my personal opinion these layers are a bit cartoonish and not the most professional looking especially since more than likely they will be on a dashboard but they do get the job done. Luckily for us there are a couple more options that we can use. Within the Map wizard there’s an option that you can use to add a Bing layer which is an aerial photo provided by NASA. In my opinion I think that this option is more refined and a bit more suited for business use as shown in the example below. I also think it adds a little bit of the Wow factor as well.
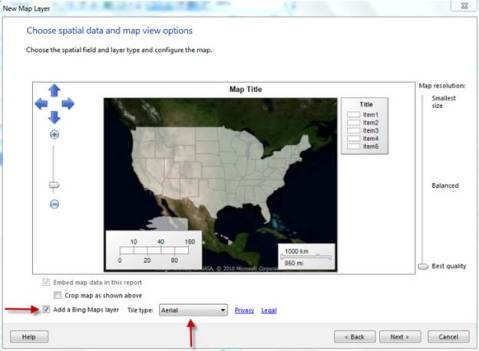
When creating the map using the wizard you have the option at the bottom on the screen to add a Bing Layer. You can simply click on the check box and then select which Tile Type as shown below. By doing this you will now have a Bing layer map.